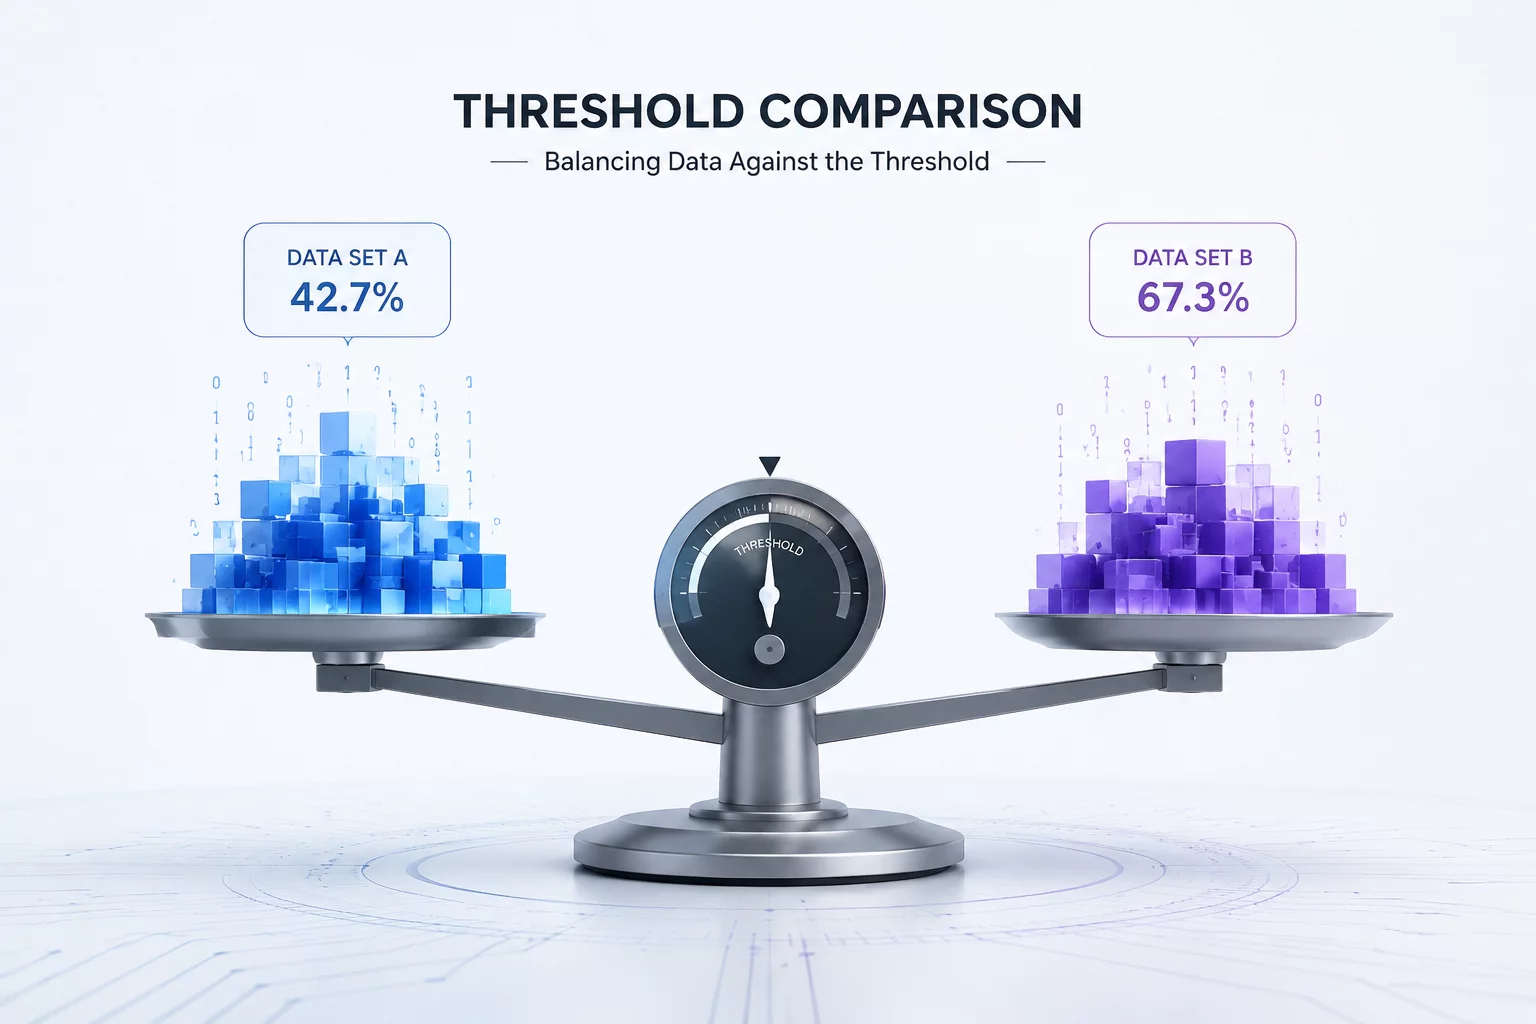
Arbitrary Boundary Brittleness
Rigid limits like P/E under 15 or RSI below 30 cause sudden binary dropouts, discarding instruments whose underlying behavior is identical to those passing by a decimal fraction.
Percentile vs. Absolute Decoupling
A filter calibrated for nominal values reacts erratically as aggregate market multiples expand or contract, turning what seemed like quality filtering into unintended sector bias.
Candidate Churn Quantification
Small parameter adjustments trigger disproportionate candidate turnover. This module measures that volatility rate before an uncalibrated screen enters routine use.
Resolving the Pitfalls of Static Boundary Filtering
Screening models frequently falter not because their underlying economic hypotheses are flawed, but because boundary conditions are enforced as brittle cliffs. A hard threshold such as a 50-day average daily turnover exceeding two million shares or a trailing twelve-month revenue growth rate greater than 20% creates a cliff effect. An asset sitting at 19.95% growth is discarded, while one at 20.05% passes into the candidate list. Over thousands of rows, these tiny cutoffs trigger massive membership churn that analysts often attribute to actual structural market rotation rather than mathematical boundary noise.
The Threshold Comparator runs parallel evaluation pipelines on identical data universes. It plots output distributions under static nominal boundaries alongside dynamic quantile cutoffs, displaying where candidate populations diverge. By computing the overlap coefficient and tracking candidate retention through step-wise parametric nudges, researchers identify whether an isolated screen isolates authentic characteristics or merely isolates a brittle mathematical subset of an otherwise continuous cohort.
Analytical Capabilities & Engine Architecture
| Specification Parameter | Value / Configuration | Application Context |
|---|---|---|
| Boundary Comparison Mode | Static Cutoff vs. Cross-Sectional Deciles | Contrast fixed numerical criteria with dynamic percentile ranks across the active universe. |
| Sensitivity Sweep Range | ±1% to ±50% Step-wise Increments | Tests how slight parameter variations affect universe inclusion and member retention. |
| Cohort Churn Diagnostic | Jaccard Index & Attrition Rate | Quantifies the exact overlap and candidate instability between successive threshold iterations. |
| Output Data Schemas | CSV, JSON, Markdown Comparison Matrix | Directly exportable for research logs, compliance filings, or downstream quant engines. |
What You Receive in the Distribution
Core Comparison Script
Clean Python script implementing vectorized comparison between static thresholds and dynamic percentile bands.
Boundary Step Generator
Configurable sensitivity script sweeping cutoff thresholds across user-specified percent deviations.
TC2000 PCF Translation Library
Pre-built Personal Criteria Formula formulas ready to deploy threshold ranges directly into chart environments.
Interpretation & Audit Handbook
Methodology brief documenting threshold stability metrics, Jaccard cutoff benchmarks, and audit standards.
Diagnostic Execution Routine
Universe Ingestion & Metric Normalization
Import candidate lists alongside raw factor measurements. The script calculates empirical distribution curves and flags heavily skewed outliers before running evaluations.
Multi-Cutoff Sensitivity Sweeps
Execute systematic adjustments of plus and minus 5%, 10%, and 20% around nominal limits. The tool records each qualifying set and traces boundary stability indexes.
Matrix Synthesis & Fragility Reporting
Generate comparative retention tables and cutoff cliffs. The analytical summary indicates whether the criterion behaves like a robust filter or an arbitrary lottery gate.
Frequently Asked Inquiries
Stabilize Your Screening Architecture
Identify and correct brittle boundary parameters in your research pipeline before uncalibrated filters degrade your universe selection.